日前我公司加薪又派發花紅。
回想過去年輕時,我曾經做過数份工,一晃就是十多年青春,無論過去的老闆是精明或刻薄,都有鋼鐵一般的鬥志,我很感激他們給我工作的機會,讓我獲得豐富的經歷。
多謝各位前任老闆,祝你們羊年大吉大利。
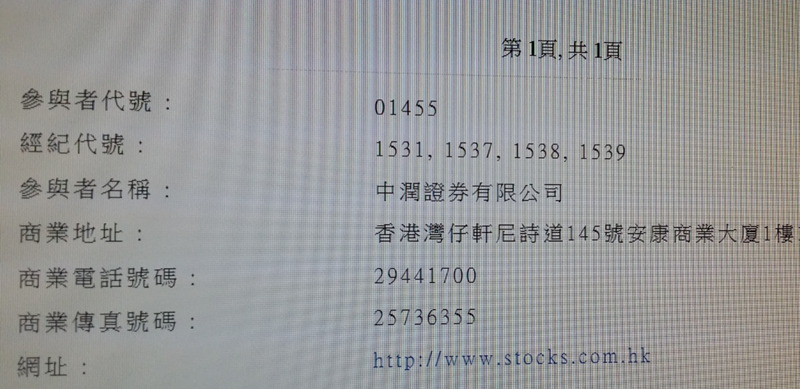
本公司持有證券交易牌照、證券提供意見牌照、資產管理牌照。本公司是「滬港通」合資格参与者。
減息啦,減息啦。
減息對什麼股票有利呢?
持有黄金是沒有利息的,所以息低,對黃金股有利。
減息,貸款者負擔減少,消費力可以提升,這類股可留意。
本公司持有證券交易牌照、證券提供意見牌照、資產管理牌照。本公司是「滬港通」合資格参与者。
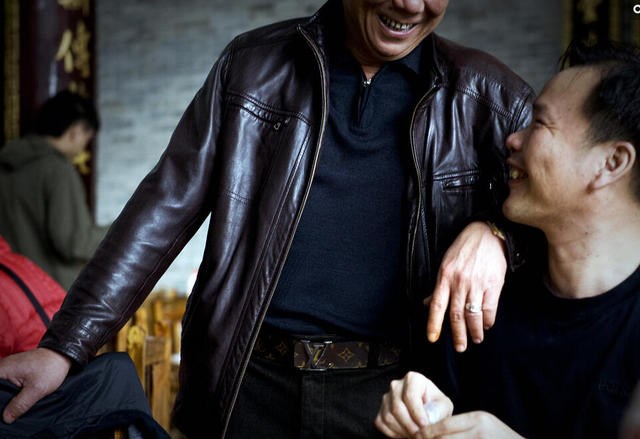
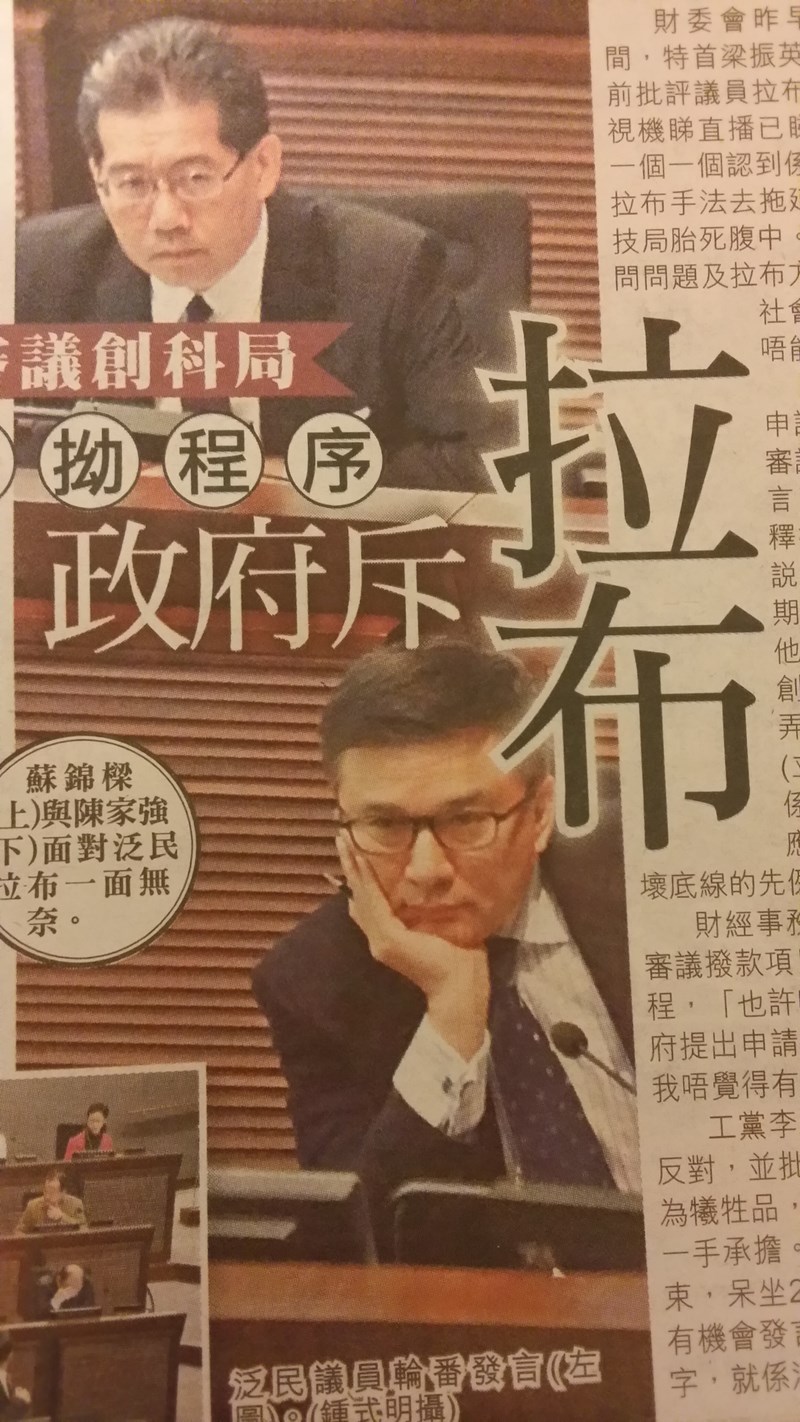
香港議員爭吵的場面常在電視新聞出現。我發覺 : 有本事的人,没脾氣,沒本事的人,大脾氣。
(本公司持有证券交易牌照、证券提供意见牌照、资产管理牌照。本公司是“滬港通”合资格的参与者。)

堅持每天指定一個時間做運動,有付出時間,才有回報健康。
救命的不是醫生,是你自己。
1997年,香港的GDP是全中國的15.6%,但今天只是2.9%。香港前路艱難,示威遊行、議員爭鬥、議會拉布、司法愎核、等等活動繼續,4年後,重慶、成都、武漢、杭州等城市的經濟總量都會追上香港,屆時香港在中國城市經濟地位,僅是一個二線城市。
二線城市,一線樓價,可以嗎?
把錢放在銀行裡,看到的永遠是錢,把錢放在股市里,看到的是企業。
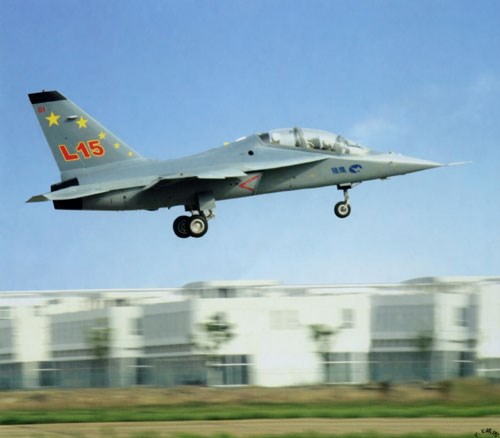
香港軍工股是大企業。
國內有幾家證券公司被罰,收緊孖展客戶,引起國內股市拋售。
事實上,正如我上月巳認為,上海股市太瘋狂了,A股太貴了,宜忍不宜追。
昨日A股大泻,與經濟無关。银行利息低,全球經濟在改善中,香港有些股票,仍然值得持有的。
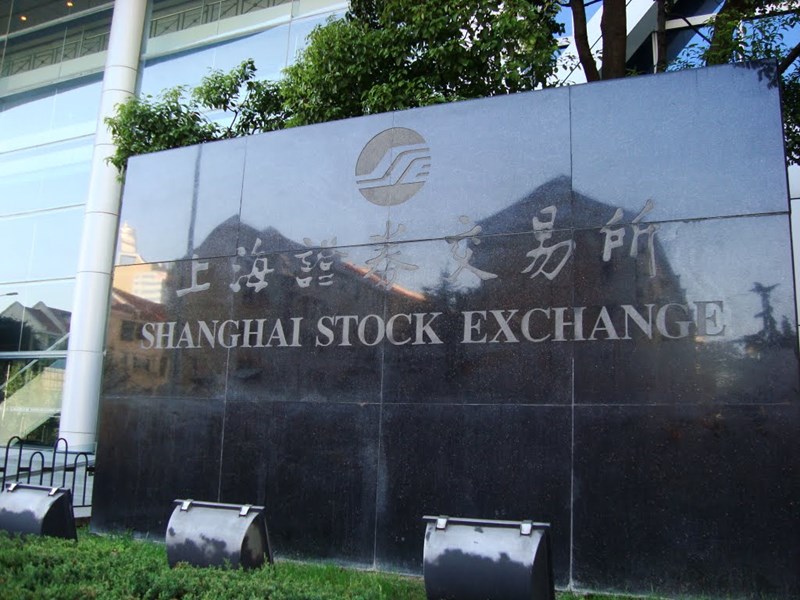
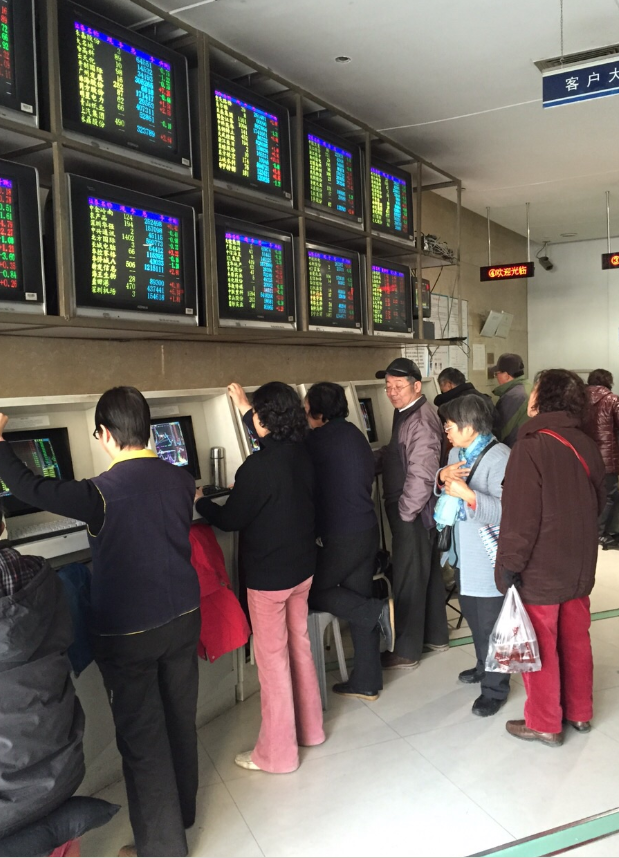
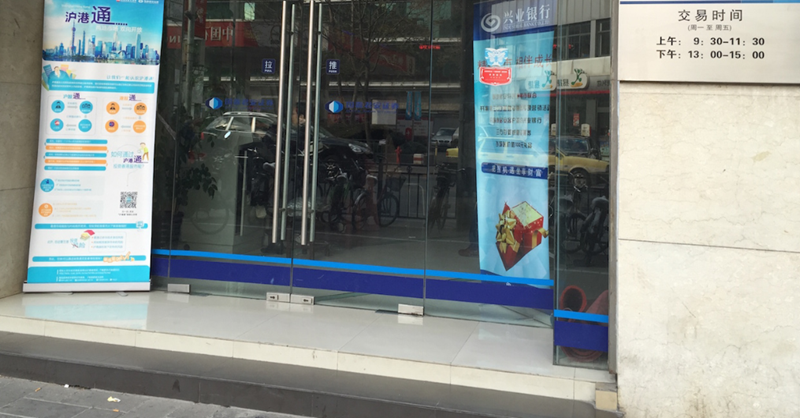
上海的證券公司, 不熱衷推動滬港通。大門口摆個易拉架廣告,寫上滬港通,場內放些草草設計的宣傳單張,現場沒有港股報價機供客戶使用。當向服務員詢間買賣港股的佣金和有沒有免費的報價服務,他們都不大了解,說要查問上司後再回覆。
國內股市狂熱,炒味極濃, 大戶室要每月有 3000 元的成交佣金。目前A股水平,宜忍不宜追。
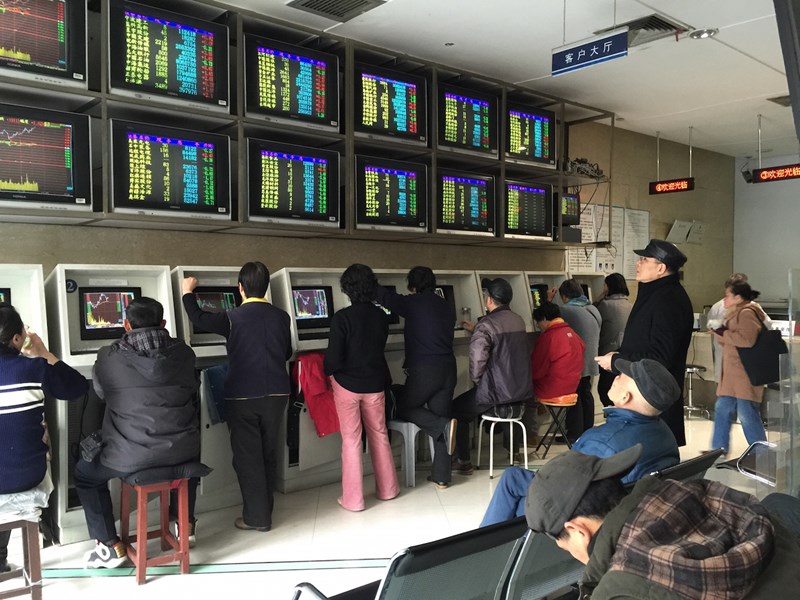
上海股票行,大客坐大房,小客塘邊鶴,大部份是上年紀的。打麻雀和炒股可以減低老人癡呆症出現,但是打麻雀有可能引起朋友爭吵,而炒股可以獲利,更可以幫助企業融資,擴大業務,增加就業率,有保家衛國作用。
所以,上海人講: 炒股票比搓麻將更加好。
敬祝各位元旦愉快!